Use a Formula in an Excel Column, Bar, Line, or Pie Chart
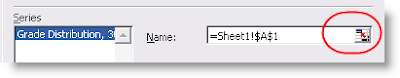
When you create Excel charts, you can populate the title with a formula. You might find this helpful to display a total quantity, such as in this example. Suppose you have 30 students and you are displaying their grade distribution in a pie chart. Here's what you do. Steps 1 - 4 set up the data; step 5 creates the Title formula; step 6 creates a pie chart. In the first column, skip the first line (A1) for the Title (we'll come back) In rows 2 - 6 of the first column (A2:A6), add the letter grades, A - D and F In column 2, rows 2 - 6 (B2:B6), add the number of grades of each type In column 2, row 7 (B7), sum the number of grades to get your student total Now go back to the first cell (A1) and add the following formula: ="Grade Distribution, " & B7 & " students" B7 is the same cell we put our total in, in step 4 If you want to format the value contained in B7m remember the TEXT functioned discussed in an earlier post Create your pie chart Highlight t